What Will Your Sales Be in September?
Ed Young
Fabricator’s Business Coach
Predicting the future is always a challenge — ask any weatherman. The problem is, if we don’t know what the future holds, it is very tough to make sound business plans. Intuition is inadequate. Guessing just won’t do. We NEED data!
The question is “How do we get that data?”
There are several different sources and levels of data that we can readily access: national economic data, regional economic data, and your leading indicators. If you pull all this data together, you can begin to predict what your sales may be in September.
National Economic Data
There are 3 primary sources for national economic data:
1) General news broadcasting companies (NBC, ABC, FOX, etc.)
2) Financial publications (Wall Street Journal, Bloomberg, Barron’s, etc.)
3) Subscription services (ITR Economics and others).
While all information sources are susceptible to human bias, paid subscription services appear to be the most objective of the three data sources above. With any of the sources listed, it pays to understand the data analysis methodology behind the reporting. You don’t have to be a statistician to know that there is a difference between tracking trends, conducting correlation analysis, and deep statistical analysis. So, dig a little deeper to understand what the information you are consuming is based on.
It is helpful to select at least two or three sources of economic data and track them regularly. Comparing the analysis of the various sources can inform your conclusions. Tracking sources over time will help you understand economic trends ahead.
Regional Economic Data
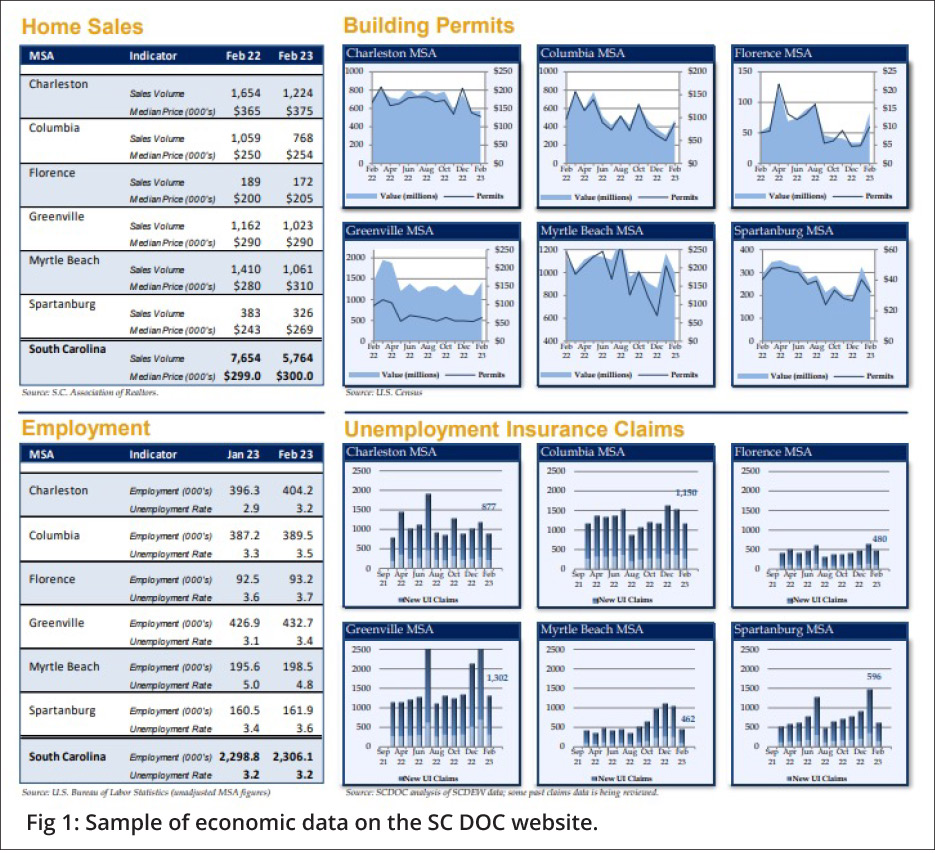
Every geographical region has an organization dedicated to economic development (ED). Sometimes this team is embedded in the state Department of Commerce (DOC) and sometimes it is a separate organization that works with the state DOC. The ED team regularly publishes data on what companies are moving into their area. It also publishes how many jobs are associated with those moves, and whether those jobs are blue-collar factory floor workers, white-collar managers, skilled trades, etc.
The state DOC typically publishes a broad array of economic data including housing starts, home sales, employment data, and much more (see Fig. 1, below). From the ED and DOC sources, it isn’t difficult to understand what the demand for housing will be in the different market segments you serve (custom home builders, big box, production builders, commercial, etc.).

Your Backyard
Closer to home, your Home Builders Association (HBA can be a surprisingly good source of information. While your customers may not attend, you should find other companies that work in the same market segments. If you currently sell into the custom home builder segment and meet a builder who works in that segment but isn’t your customer, you can ask things like: “How many homes did you build last year?” and “How many homes do you plan to build this year?” Several conversations like that can generate a good feel for how others see that market segment performing this year. Having authentic business conversations like this can also build the rapport needed to later make sales calls to those companies.
Your Forecast
Now that you have a sense of how to read the national and regional economic tea leaves, you can drill down on a sales forecast for your fab shop.
The next step is to talk to your current B2B customers. As with the HBA conversations, you want to understand how each customer thinks this year will work out compared to last year. Task each of your salespeople with having these conversations with your existing customers.
It is imperative to track the data from these conversations (see Fig. 2, below). List each customer and, for each month, show the anticipated number of jobs, the average countertop budget for these jobs, and the confidence level of the data. Your confidence level will be driven by your knowledge of that customer along with the information you gathered from the national and regional forecasts. Totaling this data by month tells you what to expect from your existing B2B customer base. Compare that to the corresponding month for last year to understand if sales will increase or decrease – and by how much.
Next, as your outside salespeople talk to prospects, they should ask these same questions and collect the same information. Here the confidence levels are likely lower because, in addition to assessing the accuracy of the prospect’s predictions, you have to include your assessment of the likelihood you will get the work.
From here the math is simple. But don’t stop with totaling the numbers for each month. You should step back, analyze the data, and determine what you think will really happen based on economic forecasts and your own experience.
This is where your intuition based on your years of experience can guide you to develop a reasonable sales forecast for your company.
Once you have your sales forecast developed, don’t put it on a shelf (or leave it in a file on your desktop). The forecast should be a living document. At least monthly, you should gather your sales team (even if it is a one-person team) and review the forecast. Adjust any data that has changed. Track how well you perform against what you predicted.
Where have you fallen short and where have you exceeded your projections – and why?
Using the data above to build and update your sales forecast is a major component in helping you run your company instead of it running you.

This changing economy will generate significant headwinds for many fabricators. If you need assistance planning for these challenges, reach out to a seasoned business owner and coach at Ed@FabricatorsCoach.com. You deserve to have a business that not only makes you money but also allows you time to enjoy it.